The rapid electrification of bus fleets has become central to China's urban decarbonization efforts, yet cities exhibit stark differences in operational feasibility, investment needs, and environmental outcomes. This study develops a nationwide, data-driven framework to evaluate bus electrification across 224 Chinese cities, revealing how heterogeneous network and city conditions fundamentally influence the cost-effectiveness and sustainability of large-scale bus electrification.
↓ Scroll down to continue ↓
Explore China's Electric Bus Interactive Map: Click Here
The burden of bus electrification varies markedly across Chinese cities, with the annualized total cost ranging from 0.01% to 1.2% of city-level GDP and the annual electricity demand accounting for 0.6% to 17.83% of industrial electricity consumption. To analyse electrification performance across Chinese cities, we classified cities into three categories based on bus network length: large, medium and small. Differences in network scale and topology across these categories further shape infrastructure deployment and cost–benefit performance.
Fig. 1 | Representative typologies of urban bus networks across Chinese cities. a, Chinese cities are classified into three groups according to bus network length, revealing substantial inter-city variation in network scale. b, Representative bus networks from the three classes—Shanghai, Xiamen and Lhasa—illustrate marked differences in network extent, route structure and charging-station deployment.
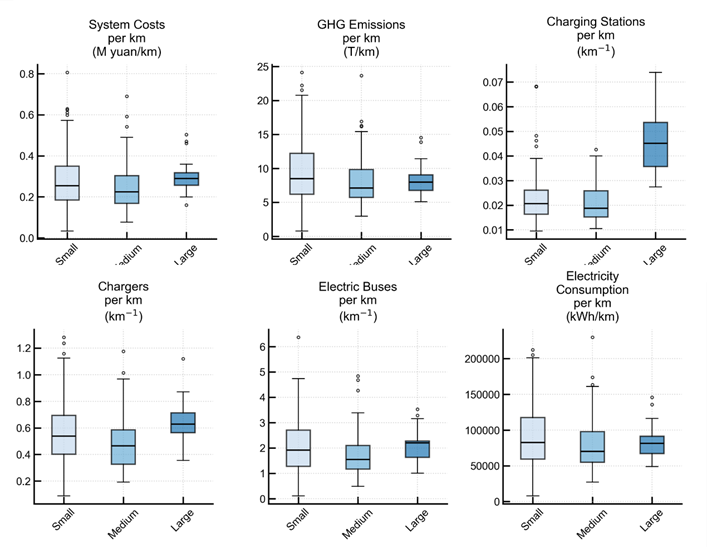
Large networks have a much higher charging station density, about 2.5 times that of medium and small networks. Medium networks show the lowest cost, emissions, infrastructure and vehicle intensity per kilometre, indicating the highest cost-effectiveness for bus electrification. Small networks have the highest emissions per kilometre, likely due to sparser charging facilities and more deadheading for charging, whereas large networks have the highest values for other input-related cost indicators.
Fig. 2 | Key electrification indicators by city class
Under technology improvement scenarios, electrification strategies diverge across bus networks of different sizes: large networks show greater potential to reduce charger deployment, whereas medium-sized networks can achieve larger reductions in the required fleet size.
Fig. 3 | Median values of electrification indicators in what-if scenarios by city class